Following up on our broader look at the North American oil and gas pipeline system, with a focus on crude and the special case of tar sands oil pipelines, this week we’ll tackle the tubes that carry natural gas.
Natural Gas in the United States
In 2009, the US used some 22 trillion cubic feet of natural gas, surpassing Russia as the world’s largest producer and consumer of the fuel. Used for everything from heating homes to lighting cooking ranges to powering fleet vehicles to firing power plants – and often cited as a cleaner-burning energy source than coal or oil – demand for the fossil fuel has spiked in recent years.
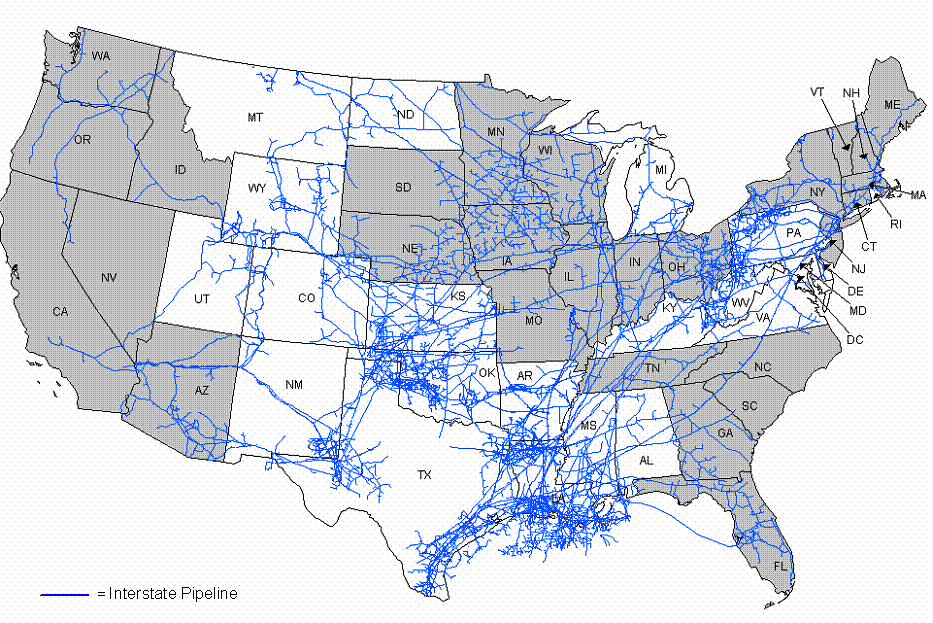
While natural gas is produced in 32 states, the top five – Texas, Wyoming, Oklahoma, Louisiana, and New Mexico, in that order – produce a full 65 percent of the nation’s total (pdf). This leaves a lot of states dependent on natural gas imports. As this map shows, 28 states need to import at least 85 percent of their gas demands.
Click here or on the map for a larger version.
Moving this huge amount of natural gas around requires a vast pipeline transmission system. Let’s take a closer look at these pipes, shall we?
The Natural Gas Pipeline System
In terms of mere reach and mileage, the natural gas lines that run throughout the country and continent dwarf those that carry crude. While there are roughly 150,000 miles of crude pipelines in the United States (about 55,000 miles of the thick “trunk lines” and 95,000 miles of refined product lines), there are over 305,000 miles of natural gas lines, all part of 210 distinct pipeline systems operated by private companies. That’s not to mention the more than 2 million miles of natural gas distribution lines and service pipelines (the smaller “delivery” lines that run through thousands of cities and towns).
On top of all that, according to the Energy Information Administration, to help the gas flow there are:
- More than 1,400 compressor stations that maintain pressure on the natural gas pipeline network and assure continuous forward movement of supplies (see map).
- More than 11,000 delivery points, 5,000 receipt points, and 1,400 interconnection points that provide for the transfer of natural gas throughout the United States.
- 24 hubs or market centers that provide additional interconnections (see map).
- 400 underground natural gas storage facilities (see map).
- 49 locations where natural gas can be imported/exported via pipelines (see map).
- 8 LNG (liquefied natural gas) import facilities and 100 LNG peaking facilities (see map).
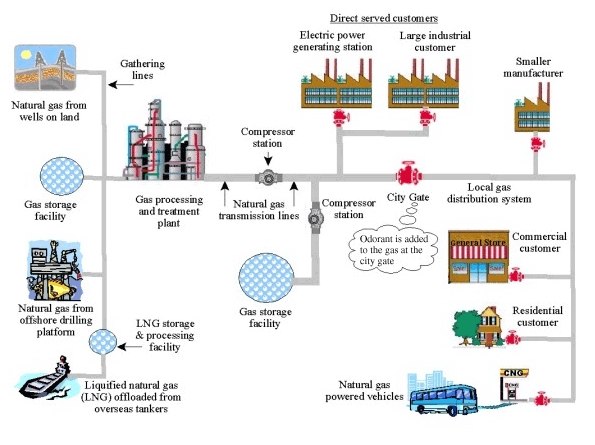
Clearly, pipelines are just one part of a larger natural gas transmission system. The Pipeline and Hazardous Materials Safety Administration (PHMSA), illustrates the system like so:
Click here or on the image for a larger version.
To oversimplify the process: Gas is gathered from underground or offshore wells, storage tanks holding imported supplies, or other reservoirs, and runs through gathering lines to a processing and treatment plant. Then, a compressor increases pressure of the gas and pushes it through the pipelines. These compressor stations are spaced about 50 to 100 miles apart and move the gas at roughly 15 miles per hour. Some of the gas moving along this subterranean fuel highway is diverted and stored in underground reservoirs to ensure steady supply through the cold winter months when demand for home heating fuel is highest. Eventually, the gas reaches the “city gate” of a local gas utility, the pressure is reduced and an odorant is added (so that leaking gas can be detected). Local gas companies move the fuel the last few miles to homes and businesses, and a gas meter on a building measures the consumer’s use.
While it’s important to understand the whole system for context, let’s hone in on the pipelines themselves. Which, again, are pretty widespread.
Where Are The Pipelines?
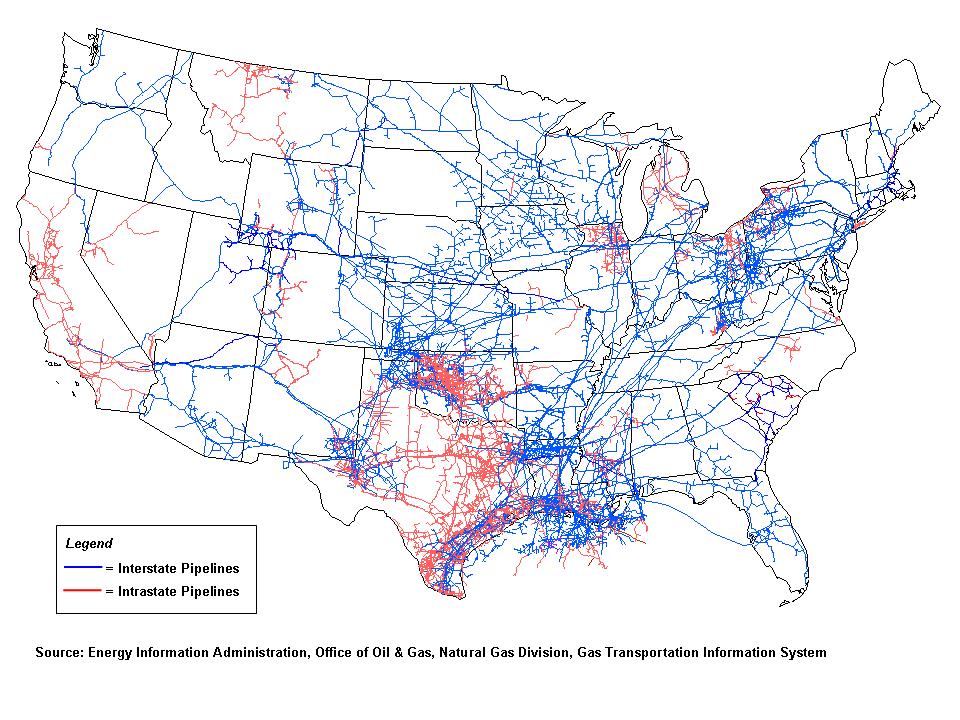
There’s no better way to show the scale of this natural gas pipeline system than with a map. Like this one from the EIA, which, to be clear, only shows the interstate and intrastate transmission lines, not those 2 million miles of local distribution and service lines:
Click here or on the map for a larger version.
While that national map is eye-opening, it doesn’t do much to answer the question that is likely in the front of anyone’s mind: how close are they to me?
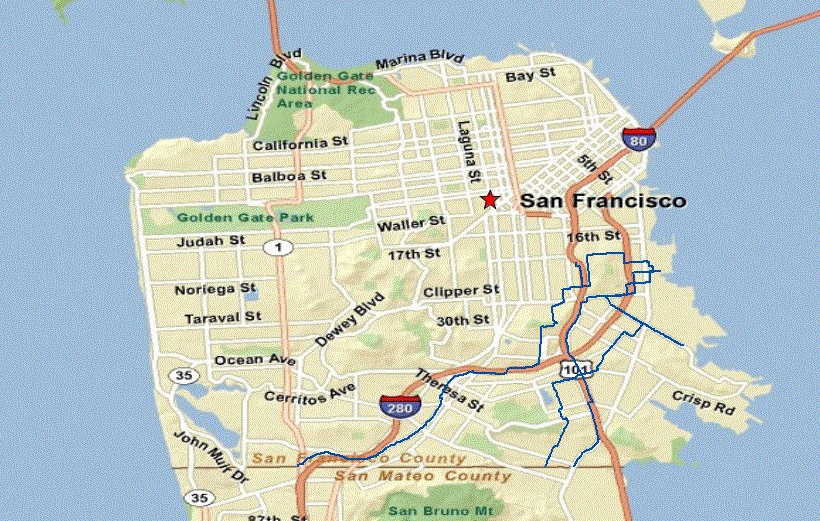
PHMSA, which is part of the Department of Transportation (DOT) actually has a helpful – if terribly clunky – mapping tool that lets you zoom in and better see where the pipelines run. The Pipeline Information Management Mapping Application (or PIMMA) lets you zoom in on the system by county. Here’s San Francisco County:
The dark blue lines in the Southeast part of the peninsula are natural gas transmission lines. As you can see, the lines disappear when they hit the city/county line. Not because they don’t connect to anything there, but because (like I said) PIMMA is a bit clunky. (If you need some help navigating the PIMMA tool, the Pipeline Safety Trust has a really handy “walkthrough” that’s well worth checking out.)
So what if you do live near a natural gas pipeline? Is it reason for concern? My next post will take a look at the state of America’s aging natural gas infrastructure, and the considerable safety and security concerns in the system.
Note: This is the third post in an ongoing series covering energy pipelines in North America. See Part 1 and Part 2.
Subscribe to our newsletter
Stay up to date with DeSmog news and alerts


