The Arctic Sea Ice is Melting – no matter how bad George Will doesn't want it to

picture-8-1346574554.jpg
on

There remains a lot of messaging and spin running rampant online over Washington Post colmunist George Willโ€™s misguided and baseless claims that sea ice coverage is similar to 1979.

DeSmog writer Mitchell Anderson has been covering this baffling story for us and doing a great job, but I wanted to provide a few of the sources that have done a particularly good job at highlighting just how much sea ice we have lost since the 1970โ€™s when we first started recording suchย things.ย 

These source easily and compellingly explain away George Willโ€™s incorrect claim that sea ice coverage is the same today as it was inย 1979.


1. You can watch the extent of Arctic Ice melt decreasing over time. Hereโ€™s a great satellite image time series video done by NASA that shows the year-to-year melting of sea ice in the Arctic. I donโ€™t know how anyone could argue that sea ice in the Arctic is the same as it was in 1979 after watching thisย video:


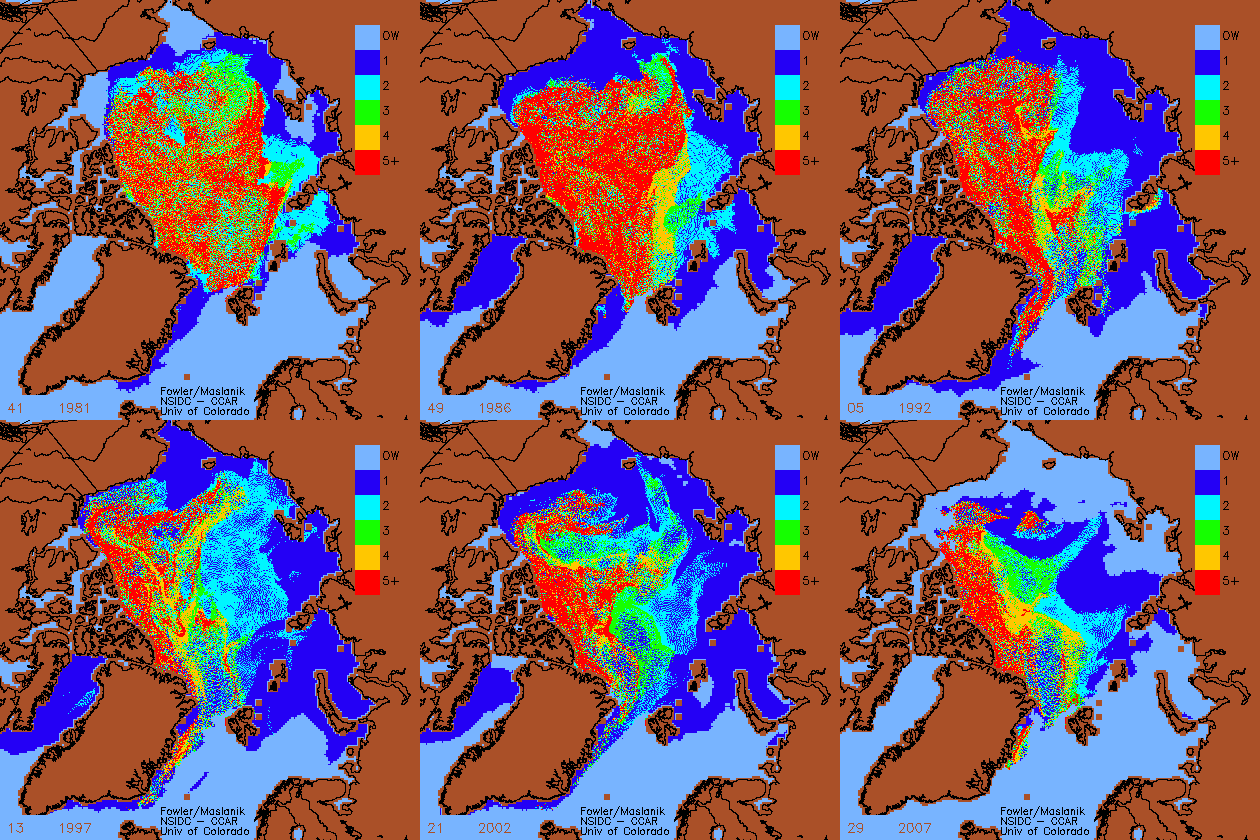
2. Old ice versus new ice. Itโ€™s a simple argument used by people looking for any reason to deny the realities of climate change to talk about sea ice โ€œextentโ€ as opposed to sea ice mass. According to the National Snow and Ice Data Center, the issue is not as much the change in the โ€œextentโ€ but the change in the thickness of the ice over time – thereโ€™s a lot more thin ice that quickly melts in the Spring as opposed to older thickย ice:

โ€œthere seems to have been a transition to younger, thinner ice beginning in the late 1970s. This reflects not only trends towards more summer melt and less winter ice growth, but changing winds that have transported fairly thick ice out of the Arctic Ocean into the North Atlantic, and decreased the length of time that ice is โ€œsequesteredโ€ in the Arctic Ocean where it might have a chance to grow thicker.โ€

So the extent of the ice – the actual surface area of the ice covering the Arctic sea – may appear large from time to time, but the amount of thick, old ice has been going down since the 1970โ€™s when scientists first began monitoring suchย things.

Hereโ€™s a great time series of the decrease in old ice in the Arctic. The colors indicate the age of the sea ice in years; light blue is open water (OW). Areas in red are locations where the ice is five years or older, whereas the dark blue areas are first-yearย ice.

So all the dark blue areas are first year ice and the bright red is 5 years orย older:


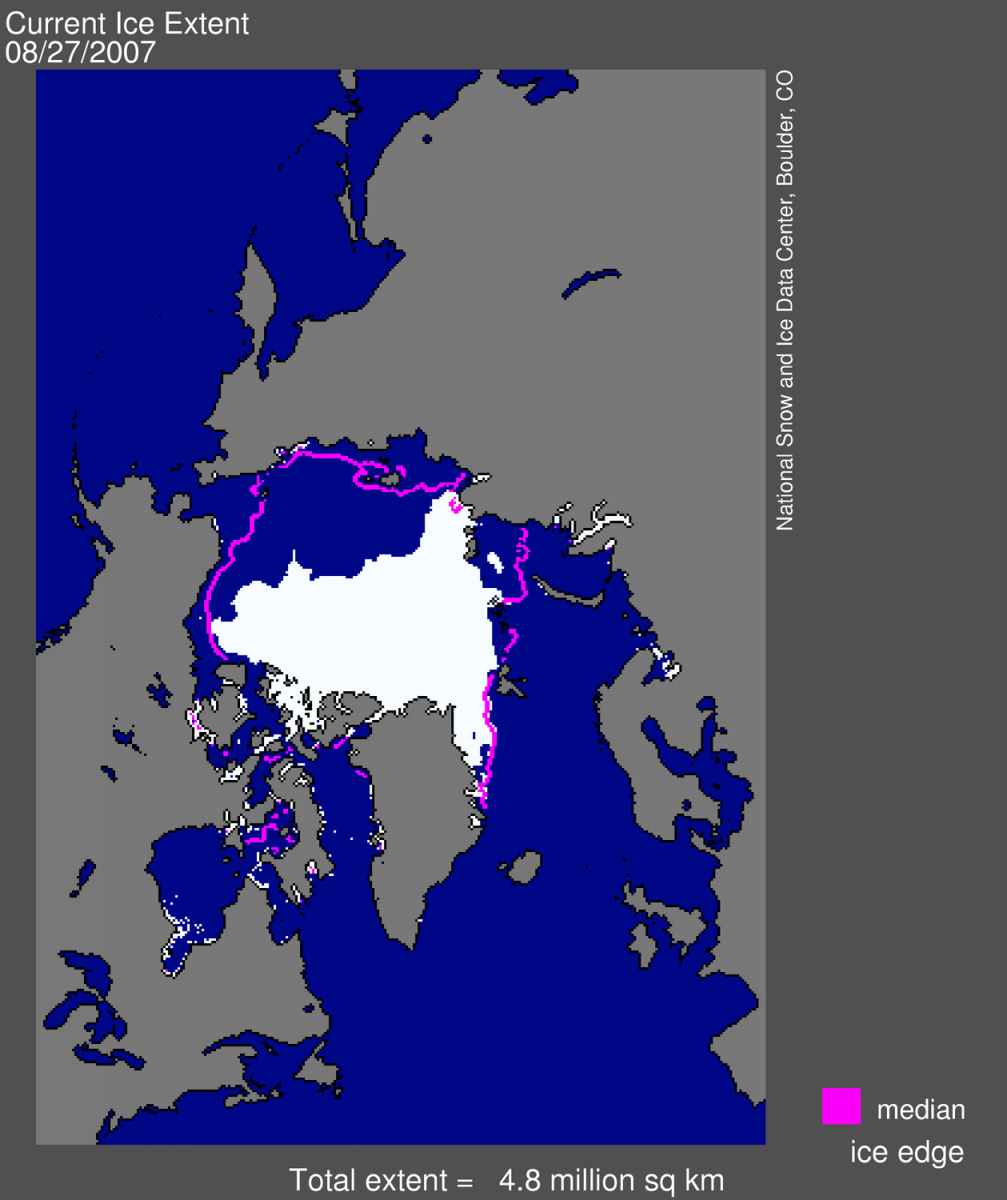
3. If you still think Arctic Sea Ice is the same as it was in 1979, then hereโ€™s a satellite image of the Arctic sea taken in August, 2007. The purple line is where the sea ice usually was between 1979 andย 2000.

This image and the animated one above were produced by the National Snow and Ice Data Center (NSIDC) in Boulder, Colorado. In fact, the NSIDC has just today released a new reportย finding:

โ€œArctic sea ice extent averaged for the month of February was 14.84 million square kilometers (5.73 million square miles). February extent was 800,000 square kilometers (309,000 square miles) less than the 1979 to 2000 average, and 140,000 square kilometers (54,000 square miles) less than for February 2008.โ€

800,000 square kilometers is a lot of ice to go missing and with all this data so easily obtained (took me about an hour), you would think it would pretty difficult for a news outlet like the Washington Post and a seasoned journalist like George Will toย ignore.


This month weโ€™re giving away FREE copies Keith Farnishโ€™s new book Times Up: an uncivilzed solution to a globalย crisis.

Go here to find out more details about DeSmogBlogโ€™s monthly bookย give-away.

ย 

picture-8-1346574554.jpg
Kevin is a contributor and strategic adviser to DeSmog. He runs the digital marketing agency Spake Media House. Named a โ€œGreen Heroโ€ by Rolling Stone Magazine and one of the โ€œTop 50 Tweetersโ€ on climate change and environment issues, Kevin has appeared in major news media outlets around the world for his work on digital campaigning. Kevin has been involved in the public policy arena in both the United States and Canada for more than a decade. For five years he was the managing editor of DeSmogBlog.com. In this role, Kevinโ€™s research into the โ€œclimate denial industryโ€ and the right-wing think tank networks was featured in news media articles around the world. He is most well known for his ground-breaking research into David and Charles Kochโ€™s massive financial investments in the Republican and tea partyย networks. Kevin is the first person to be designated a โ€œCertified Expertโ€ on theย political and community organizing platformย NationBuilder. Prior to DeSmog, Kevin worked in various political and government roles. He was Senior Advisor to the Minister of State for Multiculturalism and a Special Assistant to the Minister of State for Asia Pacific, Foreign Affairs for the Government of Canada. Kevin also worked in various roles in the British Columbia provincial government in the Office of the Premier and the Ministry of Health. In 2008 Kevin co-founded a groundbreaking new online election tool called Vote for Environment which was later nominated for a World Summit Award in recognition of the worldโ€™s best e-Content and innovative ICTย applications. Kevin moved to Washington, DC in 2010 where he worked for two years as the Director of Online Strategy for Greenpeace USA and has since returned to his hometown of Vancouver, Canada.

Related Posts

Analysis
on

The celebrity investor pitched โ€˜Wonder Valleyโ€™ with no committed investors, no Indigenous partnership, and about 27 megatonnes of projected annual emissions.

The celebrity investor pitched โ€˜Wonder Valleyโ€™ with no committed investors, no Indigenous partnership, and about 27 megatonnes of projected annual emissions.
on

City Council OKs private equity firmโ€™s purchase of Entergy gas utility, undermining climate goals and jacking up prices for the cityโ€™s poorest.

City Council OKs private equity firmโ€™s purchase of Entergy gas utility, undermining climate goals and jacking up prices for the cityโ€™s poorest.
on

With LNG export terminals already authorized to ship nearly half of U.S. natural gas abroad, DOE warns build-out would inflate utility bills nationwide.

With LNG export terminals already authorized to ship nearly half of U.S. natural gas abroad, DOE warns build-out would inflate utility bills nationwide.
Analysis
on

We reflect on a year of agenda-setting stories that charted the political influence of fossil fuel interests in the UK and beyond.

We reflect on a year of agenda-setting stories that charted the political influence of fossil fuel interests in the UK and beyond.