“Medieval Warm Period was warmer” is not only irrelevant to future climate, but was known wrong within science by the early 1990s. In 2017, it is still repeated by climate deniers. They have long misused some version of an IPCC(1990) curve, whose abuse is the focus of this MedievalDeception series. The first known promoter now seems to be Richard S. Lindzen.
He was featured in The Greening of Planet Earth (produced 1991, published 1992), a 28-minute video,* widely promoted by the coal group Western Fuels Association (WFA), which funded many climate disinformation efforts, such as those by Pat Michaels and Robert Balling, Jr. For more, see Western Fuels Association’s Decades Of Dollars For Doubt And Denial.
MedievalDeception 2015 explained the curve’s background and illustrated its 2015 abuse by Senator Inhofe.
Readers unfamiliar with this topic might review that post, but a brief summary follows.
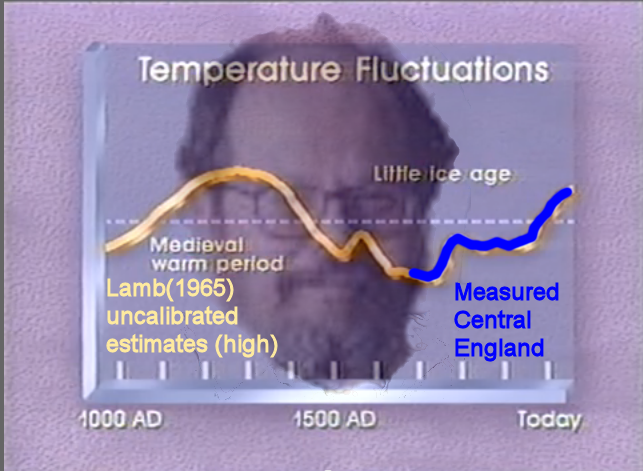
In 1965 Hubert Lamb plotted ~300 years of measured temperatures in Central England (blue), then used uncalibrated estimates to sketch the previous 700+ years (gold). Lamb carefully documented his work, labeled here”Lamb MWP.”
For lack of a better graph, a version appeared in the quickly-prepared IPCC(1990) Fig.7.1(c), surrounded by caveats ignored by deniers. They hijacked the graph to claim the Earth‘s Medieval era was much warmer and so current rise was natural and harmless (“BigMWP”). The logic is not only false, but Central England is not the Earth, and Lamb’s Medieval estimates (not measurements) were later proven to be much too high,
Paleoclimatologists doubted the curve in 1990, but uncertainty stirred research, and by 1993 the curve was deprecated and it was not included in IPCC(1995). Calibrated temperature reconstructions had replaced guesswork and kept improving.
Science has established a slow cooling of Earth from into the Little Ice Age, followed by a rapid rise into current temperatures warmer than those of Medieval times (“ScienceMWP”), as seen in the extensive PAGES2K (2013).
The Greening of Planet Earth video
This 7-minute excerpt shows Sherwood Idso, Lindzen and the German Coal Mining Association’s Gerd-Rainer Weber.
Watch slickly-deceptive claims and doubts asserted with total certainty, repeated ever since in books, blogs, articles, most ong cataloged and debunked by Skeptical Science (SkS#) via peer-reviewed science.
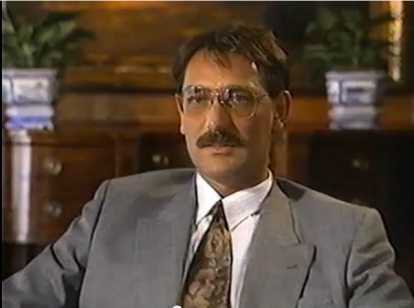
This was no informal interview with Lindzen, but a carefully-scripted tag team effort between him and Weber.
A coal-funded climate video is about as credible as a heath video by tobacco company employees. What couid go wrong?
Thousands of copies were distributed and it was apparently popular in the Bush White House. People might watch the whole thing, but 7 minutes is enough to see the first-known BigMWP misuse of Fig. 7.1(c), in context.
09:58-10:36 Sherwood Idso, (world turns green, including deserts) .. crops in Sahara? Mid-Australia? really?
‘As the efficiency with which plants utilize water in the years ahead, as the CO2 content rises, plants will obviously be able to grow and survive in areas where they currently cannot because of a lack of water. That means you should see a tremendous redistribution of plants on the face of the Earth.
In very general terms you should see a real greening of the desert. You should see grasses, tall shrubs moving out into areas where they could not live and survive and reproduce before. Then there should be a tendency for bushes and shrubs to grow where only grasses have grown in the past. And of course, forests should greatly expand their ranges.’
SkS#120 ”CO2 is plant food” (much of the video was devoted to this meme)
.
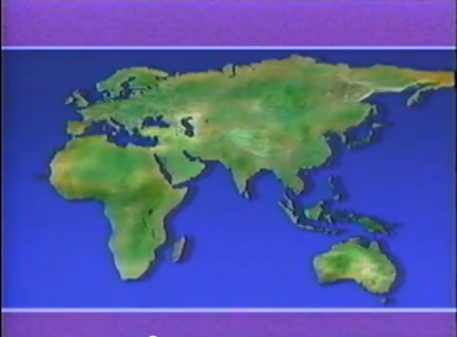
Additional CO2 helps some (“C3”) plants grow better, to some extent, if that is the limiting factor among sunlight, temperature range, water and other nutrients.
Liebig’s Law of the Minimum always applies, no matter how much some ignore it. Weeds often respond well to CO2 and poison ivy or kudzu indeed green the Earth as does greening in marginal scrublands or Boreal forests. None of those help grow food, and neither do the side-effects of CO2-incurred heat, like droughts, floods, salt water incursion.
10:37-11:19 Narrator Computer Simulations
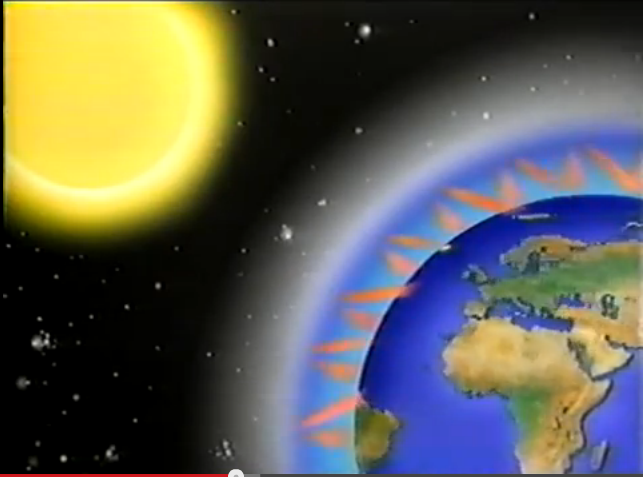
11:20-11:41 Weber on models
‘What computer models are doing is they are trying so simulate the physics and the chemistry that is going on in our atmosphere. However, the chemistry and the physics are so complex that even if we knew all the processes that have a bearing on climate, it would be very hard to model it – to simulate it – with a set of physical or chemical equations.’
SkS#5 “Models are unreliable”
.
.
11:42-12:23 Lindzen on models
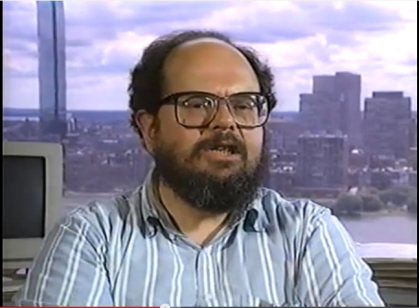
SkS#5 “Models are unreliable”
This repeats a common denialist fallacy: “We know nothing unless we know everything.”
.
12:23-12:36 Weber on models
‘We don’t even know all the processes, for instance, that are taking place between the biosphere of the Earth and the atmopshere. We do not know all the processes that are taking place between the oceans and the atmosphere, clouds and the atmosphere,’ SkS#5 “Models are unreliable” “We know nothing unless we know everything.” again.
12:37-13:17 Lindzen on vague, unsourced predictions by unnamed models
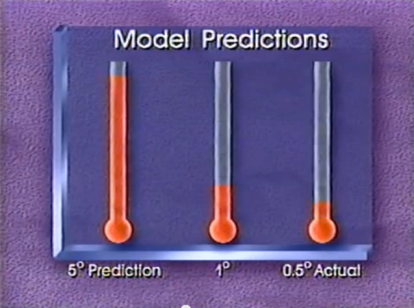
SkS#2 “Climate’s changed before” Unsourced strawman. Which models?
SkS#85 “It’s not us”
13:18-13:30 Weber ‘So the reality falls at least about 50% short of what the models predict and this is really one of the major issues. We simply don’t see at this point the warming the models predict.’
13:32-14:25 Lindzen BigMWP – warmth much higher than 1992, implied global, not tiny patch of England.
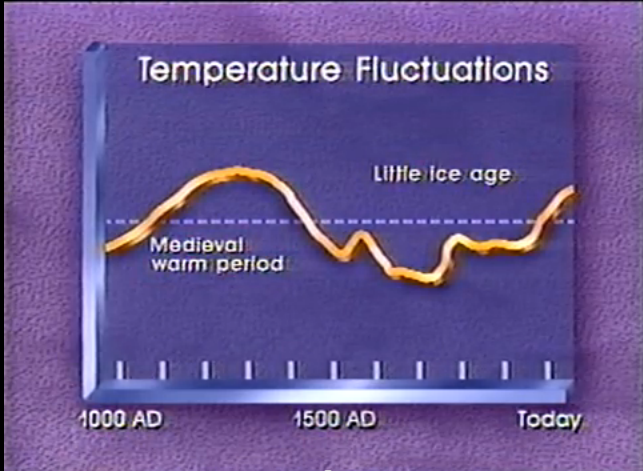
SkS#56 “Medieval Warm Period was warmer” (Not that it matters, but not global.)
He certainly had access to IPCC(1990),** but he and Weber*** ignored the caveats.
Experts can be wrong, but Lindzen was determinedly wrong outside his expertise.
Unlike real paleoclimatologists, who already expressed serious doubts, Lindzen spoke wrongly with total certainty, based on pre-thermometer estimates for a tiny part of England.
“Grapes” do not prove equal warmth or good wine as per RealClimate, In Winelands of Britain, wine grapes are moving Northward, already warm enough in Yorkshire (via personal on-site testing, further North than in Medieval era), but still Scotland’s first wine branded ‘undrinkable’ by critics (2015). From expert opinion, Scotland’s time is coming.
Lindzen’s curve is slightly offset from Fig.7.1(c)„ roughly 50 years early.
14:26-14:55 Weber
‘You know as we move into the late 1980s, early 1990s, oceanic models have become much more sophisticated and there have been several attempts by major modeling groups to couple realistic ocean to atmospheric models. And some of those models will show that the warming that people expect for the coming decades is considerably less than what older models had expected.’ SkS#5 “Models are unreliable” and of course, these are unspecified models.
14:56-15:40 Lindzen
‘I probably share the puzzlement of a lot of people in trying to understand why modest warming is treated as one of the greatest dangers facing mankind. I simply do not know why. I do know what I have seen as have most other people on television – you know – pictures of palm trees in Boston, Washington under water, and those indeed are part of what I suppose one could call a cataclysmic scenario, but to the best of my knowledge they have nothing to do with what any scientist predicted, regardless of which side of the issue he is on.’
The video is a fine compendium of exaggerations, cherry-picks, unsourced strawmen and hijacking a curve from its surrounding caveats. Had Lindzen actually cited IPCC(1990), mispresentation/falsification would have applied. As is, it was simply deceptive, Lindzen did not actually say temperatures were global, nor measured, but who would guess that?
Climate deniers temporarily forget Fig 7.1(c), although not general BigMWP idea
In real science, Fig.7.1(c) was caveated in 1990, had been deprecated by 1993, and was replaced by series of increasingly-better temperature reconstructions, i.e., ScienceMWP
1998 As part of the Oregon Petition effort, the paper by Art Robinson, Noah Robinson and Willie Soon(1998) included some BigMWP claims, did not use the curve, but did misuse a Sargasso Sea curve from Keigwin(1996).
1998 WFA‘s front Greening Earth Society funded The Greening of Planet Earth Continues. Thomas Gale Moore (economist) spoke about inherent variability of climate, 03:17-03:59, and offered yet another unsourced, animated curve, at right.
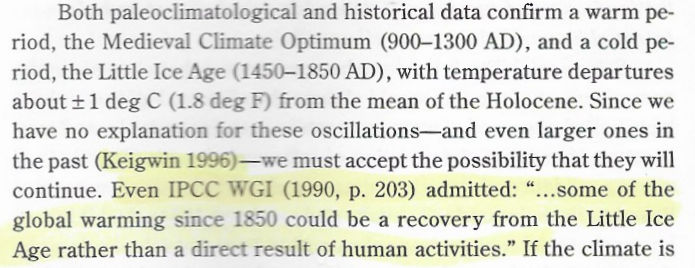
1998/1999 Fred SInger claimed BigMWP in Hot Talk, Cold Science (1998 or 1999), whose p.56 cherry-picked a sentence from IPCC(1990), p.203, but did not show p.202’s Fig.7.1(c). He obviously had a copy, which is relevant to later falsehoods. As per Medieval Deception 2015, all this was already obsolete in real science. He also repeated misuse of Keigwin.
1999 Thomas Gale Moore, in Climate of Fear: Why We Shouldn’t Worry about Global Warming (1999) spent pp.23-68 reviewing climate history, much with reference to Lamb, promoting BigMWP, but again without the curve.
WFA-funded World Climate Report published a few posts on the topic, but none I could find used FIg.7.1(c).
2000 WFA non-scientist “scientific consultant” John Daly retrieved the curve, to be covered in MedievalDeception 2000.
Lindzen and coal money – at least 25 years
1991 Lindzen testified for Senate, Global change research : the role of clouds in climate change October 7, 1991.
The WFA paid his travel expenses, at least.
1995 in first Minnesota Social Cost of Carbon case, Docket 93-583, WFA‘s expert witnesses were Lindzen, Sherwood Idso’s son Keith, Pat Michaels and Robert Balling. Lindzen answered a question 05/23/95 p.8 about testifying for WFA:
“As I said in my testimony, I’ve never testified on behalf of them, but there was one Senate hearing from Al Gore where I discovered that, of course I could use neither my grants nor did the government pay for attendance, and Pat mentioned that Western Fuels could help with the expenses and I called them and they did provide the travel expenses for that hearing.” People need great care in asking questions. Unfortunately, no one asked if he got paid more than travel expenses or about the 1991 video,. He did not volunteer such information.
2015 Lindzen expert-witnessed again for coal, in Peabody’s Outlier Gang Couldn’t Shoot Straight In Minnesota Carbon Case, Judge Rebuffs Happer, Lindzen, Spencer, Mendelsohn, Bezdek, although Lindzen was still owed money in 2016.
Update 10/28/19: Add excerpt from SInger(1998,1999).
* Copies of this video tend to get marked Private sooner or later. If so, search YouTube for “greening of planet earth,” produced/copyrighted in 1991, released in 1992. It did not acknowledge IPCC for use of the Fig.7.1(c) graph.
In any case, readers can peruse a transcript.
** Lindzen reviewed IPCC(1990) in April 1991, often critically. He quoted specifics by page, including one just a few pages beyond (p.202) Fig 7.1(c), in the same section: “the caveat (p.209) that “the estimate provided by Jones et al (1989) of a maximum overall warming bias…” It is hard to think that he adapted Fig. 7.1(c) without noticing the surrounding warnings.
*** In his 06/01/91 Global Warming-The Rest of The Story, Weber referenced IPCC(1990) several times, showed the Manley(1974) Central England series, Fig.30, p.118, and referenced Lamb(1988), whose Figure 3.1 gave the curves, with explanations. Lamb was specific about methods and geography, and IPCC(1990) gave clear caveats. Weber certainly knew enough to recognize the Lamb curves, but it is unknown whether or not he and Lindzen communicated on this.
Acknowledgement: Ross Gelbspan’s The Heat is On (1995, 1998) was invaluable regarding Lindzen’s early activities.
Image Credits: Western Fuels Association.
Subscribe to our newsletter
Stay up to date with DeSmog news and alerts


