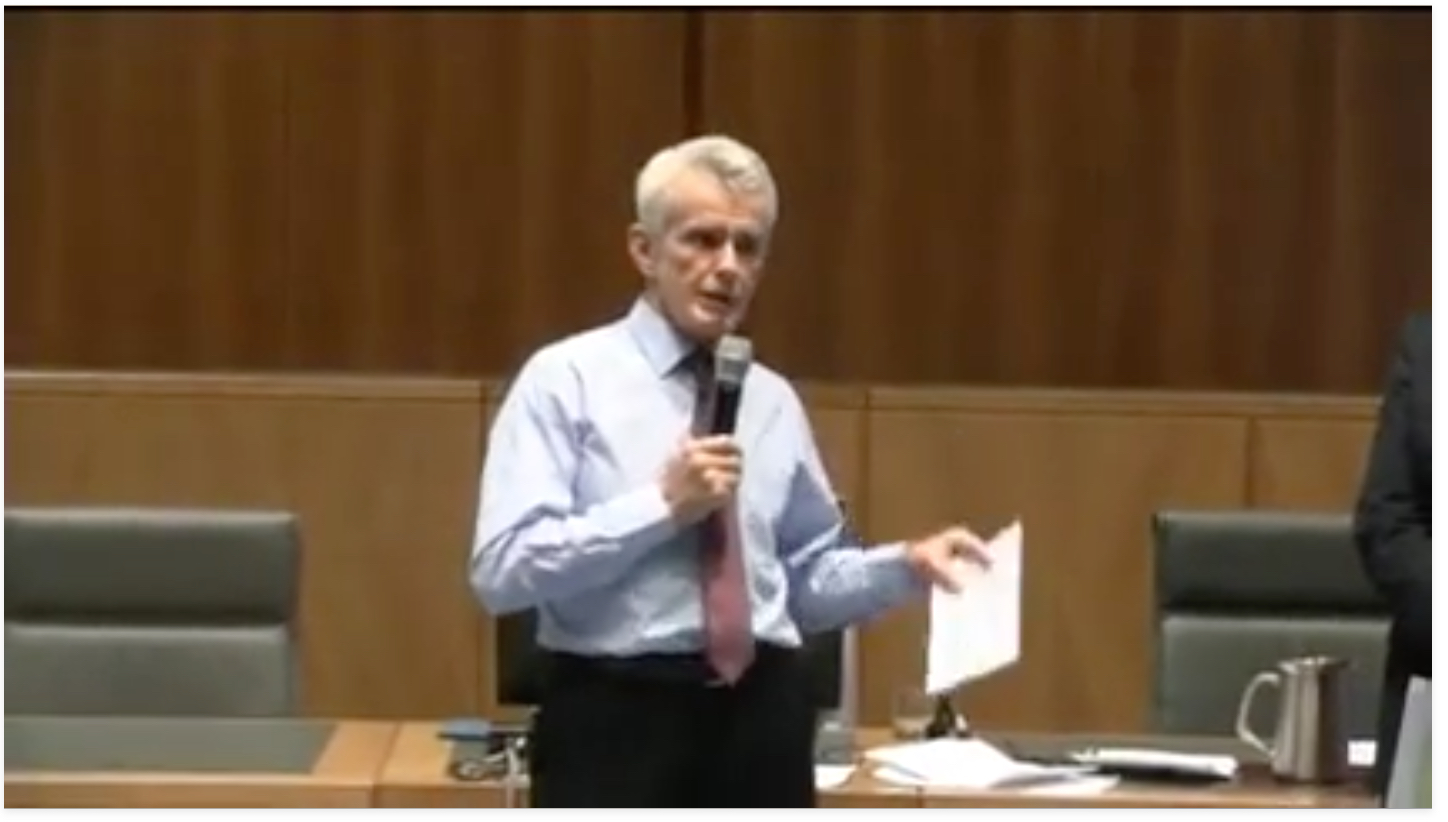
Senator Malcolm Roberts is an Australian climate science denier on a mission to convince the world that climate change science is a fraud.
In recent weeks in Parliament, on prime-time television and in forums, Roberts has been flaunting his rejection of scientific evidence like a dodgy second-hand car salesman with a sideline hawking homeopathy remedies to astrologists.
Roberts was elected to Australia’s upper house in 2016 thanks to the country’s unfathomably complicated preference voting system.
The former coal miner rode into the Senate on a wave of populist far-right rhetoric from Pauline Hanson and her One Nation Party. Only 77 voters actually ticked the box next to Roberts’ name.
In an investigative documentary into One Nation produced by the Australian Broadcasting Corporation’s flagship Four Corners program, Roberts accused the aforementioned ABC of using “Nazi-style mind games”.
“What’s your evidence for that,” asked ABC reporter Caro Meldrum-Hanna, handing Roberts that metaphorical length of rope with which to hang himself.
Ever quick with the catchy soundbite, Roberts responded: “Um… for example, carbon dioxide… ah… has been, whenever we talk about carbon dioxide on the ABC… um… you see on the news broadcast billowing steam pouring out, giving people the impression that carbon dioxide is both… um… colourful and it’s also huge in volume when it’s less than 0.04 per cent.”
Righto Malcolm.
Galileo Movement?
Before his political career, and after at least a couple of decades in the coal industry, Roberts was the co-ordinator for the Australian climate science denial group the Galileo Movement.
One Nation has adopted the Galileo Movement’s climate positions as its own policy by cutting and pasting them. Literally.
Anyway, on 29 March Roberts held a forum in a committee room in Canberra’s Parliament House, promising to pick apart the data on climate change. “Come check for yourself,” said the invitation email.
So that you don’t have to, I’ve watched the whole sorry two-hour live Facebook stream that has attracted 27k views so far.
Robert’s forum started just six hours before a similar denialfest hearing began in Washington DC before the House Science Committee, chaired by the Republican climate science denier Lamar Smith.
Roberts was in Washington DC in December 2016 for a meeting of climate science denial activists. That meeting included at least three members of a team assigned by then President-elect Donald Trump to prepare the government’s Environmental Protection Agency for an onslaught of cuts to environmental and climate protections.
That House hearing featured only one scientist whose views on climate change match those of every scientific academy around the world — that climate change is human caused and things are destined to get messy [my summary] without rapid action to cut greenhouse gas emissions.
That scientist was Professor Michael Mann, of Penn State University, whose scientific papers studying global temperatures in recent centuries concluded with the famous “hockey stick” graph showing a sharp global rise in temperatures in recent decades.
Forum to Misrepresent
Mann is the bête noire of the climate science denial movement and so it was perhaps not surprising that back in Canberra, Roberts decided to launch a critique.
“Mann’s paper has been thoroughly debunked,” claimed Roberts.
“The 2001 UN report prominently featured Mann’s graph and that drove scary headlines around the world saying that we have got a problem. Then Al Gore featured it prominently. Then after it was debunked by reputable statisticians including one who worked and gave evidence to the American congress, the UN just pulled that little graph out of prominence altogether. It’s complete rubbish.”
And so herein starts our fact check of Roberts’ forum. Strap yourselves in.
What is “complete rubbish” is Roberts’ interpretation of facts. Here’s what the 2001 UN report from the Intergovernmental Panel on Climate Change (IPCC) actually did with the work of Mann.
Mann’s work did feature prominently in the 2001 IPCC report, known as the Third Assessment Report. But what happened after that? Did the UN “pull” that little graph for the follow-up 2007 report?
No.
Rather, Mann’s data was included on a chart showing how his study had been replicated in the intervening years by several others, using different datasets and methodologies. They had all come to similar conclusions that recent decades had been exceptionally warm compared to recent centuries.
So the IPCC did not pull the graph “out of prominence altogether” but pretty much the opposite. Not only that, but the IPCC summarised the criticisms that had been made of Mann’s work and explained their deficiencies.
There’s a lengthy scientific summary of the issue in the IPCC AR4 report, which concludes that the warming in the late 20th century was probably “greater” than had been suggested in the previous 2001 report.
This style of misrepresentation was plentiful in Roberts’ forum where he was flanked by three speakers — Peter Bobroff, Howard Brady and Bill Johnstone.
Bobroff, a retired Navy commander and Roberts’ cousin, took the audience through a series of graphs of temperature data.
Despite continually interpreting the data to claim it showed nothing to worry about, Bobroff said: “I’m the data guy – I’m not the interpretation of atmospheric physics theory or anything like that.”
Australian Temperatures
Retired scientist Bill Johnstone was given a platform to repeat ill-founded concerns raised during a series of articles in The Australian newspaper (which themselves came from climate science denier blogs) that temerature records kept by Australia’s Bureau of Meteorology’s (BoM) were unreliable.
Australia’s temperature data shows the continent has warmed about 1C since records began a century ago.
Johnstone’s argument was that the bureau’s temperature data was unreliable because of the way it handled changes to temperature stations, such as when buildings go up around thermometer sites or vegetation is removed or grown. Johnstone seemed frustrated that he hadn’t been given more time by Roberts.
So let’s not waste any more of our time. The BoM has provided one chart that pretty much debunks Johnstone’s entire argument.
The chart shows two datasets — one dataset has been adjusted in a way that Johnstone doesn’t like, and one shows unadjusted data. They are almost identical.
Sea Level Denial
Next up to confuse the viewers about sea level rise was Howard Brady. Brady has been used as an authority on sea level rise and climate change before by The Australian newspaper.
But researchers at the ABC’s Media Watch (you know, that Nazi-style propaganda unit) described him as “knowledgeable, but he’s an amateur” on climate change.
Brady told the One Nation forum that in 2007, the IPCC “ignored the tide gauge data and jumped straight to the satellite data” because tide gauges were not showing a sufficient rise in sea levels. It’s a conspiracy, you see.
So did the IPCC do what Brady claimed?
Well, the Permanent Service for Mean Sea Level (PSMSL) is based in the UK at Liverpool’s National Oceanography Centre. This was the data Brady said the IPCC ignored.
Updating the scientific community on the status of the PSMSL dataset, the scientists at the centre noted in a 2013 article in the Journal of Coastal Research that the 2007 IPCC report “contained citations of 28 papers that used the PSMSL data for long-term global trend reconstruction.”
The more recent IPCC report released in 2013, which also includes measurements from tide gauges, says:
Global mean sea level has risen by 0.19 m over the period 1901–2010, calculated using the mean rate over these 110 years, based on tide gauge records and since 1993 additionally on satellite data. It is very likely that the mean rate was 1.7 mm per year between 1901 and 2010 and increased to 3.2 mm per year between 1993 and 2010.
This assessment is based on high agreement among multiple studies using different methods, long tide gauge records corrected for vertical land motion and independent observing systems (tide gauges and altimetry) since 1993.
Brady’s claim that the IPCC ignores data on tide gauges is demonstrably false. There is also evidence that sea level rise is accelerating, which Brady claimed didn’t exist.
Brady also used a slide of several charts showing tide gauge data at a handful of locations around the world. The charts were from the US National Atmospheric and Oceanic Administration (NOAA) and you can see where Brady got them from here.
Referring to the straight trend lines on the charts, Brady said these lines “are not curving up like a car ramp” and so proved, according to him, that sea level rise was not accelerating.
Yet regardless of whether Brady’s hand picked selection of locations show accelerating sea level rise or not, the charts Brady displayed would never show a curved trend line. That’s because the trends are calculated for the entire period so all you will ever get is a straight line.
Wrong Models
Brady showed too that he doesn’t understand how climate models work.
He claimed that early climate models from the 1970s had a preset measure of how sensitive the Earth’s temperature was to CO2.
Brady appeared to claim that all models that followed were subsequently also wrong, because they all contained this incorrect assumption.
Except climate models do not have a preset measure for the sensitivity of the climate to CO2. Brady has it back to front.
Rather, as Professor Steve Sherwood of the University of New South Wales Climate Research Centre explained in a recent Positive Feedback podcast, this sensitivity figure is one of the results of climate modelling, not something you enter into them.
Throughout Robert’s forum to “check the data” the Senator and his suite of non-experts treated the audience to an object lesson in climate science denial with false claims, cherry-picked data and misrepresentations. Roberts claimed he was showing the data that the IPCC ignores, when anyone with an internet connection can see that he’s wrong.
But how did his happy band of Facebook fans feel?
“The globalists want total control,” said one, while another had his own theory on global warming. “Simple put one person in a room its normal — put 10 people in a room the room temp[erature] rises. Billions added to planet it slightly warms.”
That’s right folks. Human-caused global warming is real, just not in the way that you, or almost anyone else, understands it.
Main image: Malcolm Roberts during a Facebook stream of his “climate change forum”.
Subscribe to our newsletter
Stay up to date with DeSmog news and alerts


