Photos of Colorado’s spectacular Rocky Mountains draw tourists to the state from all over the world, but if people could see the extent to which oil and gas drilling is polluting the state, they might think again about visiting.
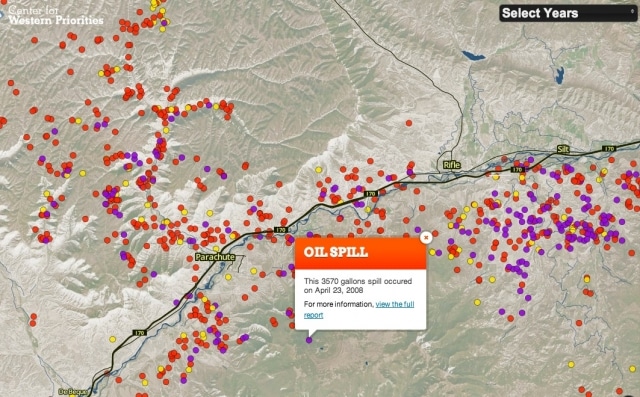
DeSmogBlog has posted infographics about oil spills resulting from transportation, pipeline leaks and other disasters. Now the nonpartisan Center for Western Priorities has posted a detailed, interactive Western Toxic Release Map that plots over 13,600 spills from oil and gas operations that occurred in New Mexico and Colorado between 2000 and 2013.
The color-coded map tells whether the spills consisted of oil, brine, drilling water, or other substances. It shows that the highest number of spills occurred in four main areas of Colorado: between Grand Junction and Glenwood Springs on the central western side of the state, the area surrounding Rangely in the northwest, an area around Durango, Farmington (NM) and Trinidad in the south, and around Greeley in the northeast.
Each dot on the map represents a documented spill, and each dot links to a full details about the spill as reported to the Colorado Oil and Gas Conservation Commission.
These are just reported spills.
Using a sort function, map users can also see the number of documented spills that occurred each year.
The map also helpfully sums up the number of documented spills, along with the total quantity of fluids spilled by oil and gas operations in this area from 2000 to 2013: 1,479 total spills and a total of 8,021,118 gallons of hazardous fluids.
Subscribe to our newsletter
Stay up to date with DeSmog news and alerts


