Update: NSIDC pinpoints Sept. 19 as date of least Arctic ice extent in 2010
Arctic Sea Ice Extent, which the National Snow and Ice Data Center (NSIDC) in Boulder, Co., announced had reached its annual minimum on Sept. 10, has now slipped even further, to a point that could be below the 2008 minimum. That would make this the second lowest summer ice cover in recorded history.
“It’s awfully close (to the 2008 low),” NSIDC research scientist Dr. Walt Meier said on Wednesday (Sept. 22, 2010). “And even though the air temperatures are getting colder, the ocean has a lot of heat in it and can continue to melt ice.”
Meier acknowledged that the NSIDC jumped the gun in announcing the apparent annual minimum. The ice extent had been increasing for three consecutive days and the scientists assumed the season had turned. But much of the ice is broken up and thin, conditions that mean “it doesn’t take a lot to get late season melting,” Meier said.
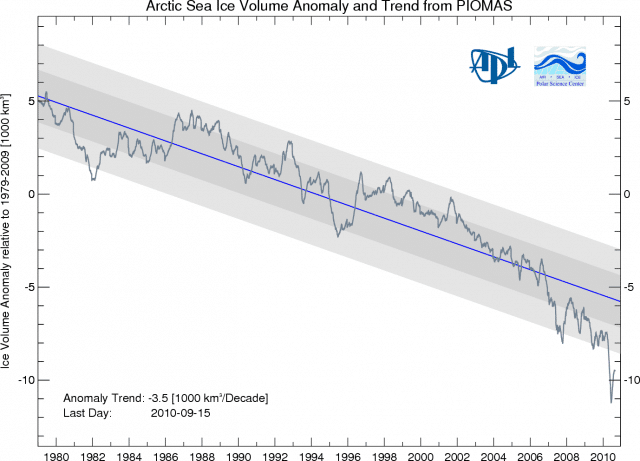
Ice watchers may be more concerned, however, by the inset Polar Science Center graph of ice volume, which shows that the total amount of ice (as differentiated from the extent of the Arctic ice cover) has dropped off a cliff.
The Arctic Sea Ice Volume Anomaly illustrated in this figure is calculated using the Pan-Arctic Ice Ocean Modeling and Assimilation System (PIOMAS) developed by Dr. J. Zhang and collaborators at the University of Washington. It suggests a precipitous decline, including eight consecutive years when the ice volume has dropped sharply down even from the declining trend line.
The problem, as the scientists at NSIDC have been saying for years, is that old, thick, multi-year ice has been melting and getting replaced by young, thin ice. The total amount of ice is therefore diminishing to a degree that is not fully revealed by the declining ice extent.
Dr. Meier says quite willingly that neither measure is fully satisfactory. The NSIDC ice extent measure is more directly reliable, in that it is the result of observation rather than modeling. But the satellite data still needs to be interpreted and the NSIDC test – that any particular quadrant has at least 15% ice cover – is difficult to calculate exactly.
The NSIDC uses the 15% number because “that seems to correspond most closely to the actual ice edge,” Meier says. But in a quadrant that is 25 kilometres square, that could mean there is dispersed ice floating over the whole area or one solid chunk filling up 15% in one corner of the quandrant. The dispersed ice might appear to cover a larger area, but it would also be more vulnerable to melting from the warm ocean than would ice in one consolidated piece.
As for the PIOMAS Arctic Sea Ice Volume Anomaly, it has been widely validated, most obviously against the NASA ICESat Satellite data, but it still derives from a mathematical model, a fact that will always attract criticism from a denier community that either doesn’t understand modeling, doesn’t want to, or both.
Nevertheless, even assuming big margins of error (the Polar Science Center graph shows one and two standard deviations), Arctic ice is in a period of extensive and consistent decline. And given that melting ice sets up a positive feedback loop – with the dark ocean now absorbing radiative energy that was once reflected by white ice – this promises to create more trouble. And unless you are inclined to completely ignore or cavalierly misrepresent the evidence, that you cannot deny.
Subscribe to our newsletter
Stay up to date with DeSmog news and alerts


